Chapter 3 - Supervised Learning#
Classification vs Regression#
Understanding the Difference#
1. Predicting Categories vs Numbers#
Classification is like sorting mail in an office:
You look at each piece of mail’s features (size, markings, address type)
Based on these characteristics, you sort them into specific bins (Urgent, Regular, Spam)
The decision is always categorical - each mail goes into exactly one bin
Regression, on the other hand, resembles the task of predicting a child’s future height:
You analyze factors such as the heights of the parents, their nutrition, and the child’s age.
This analysis allows you to forecast a specific numerical value.
The output is a continuous value, representing a range of possible heights.
2. Real-world Examples#
Examples of Classification:
Email Filtering: Classifying emails as Spam or Not Spam.
Medical Diagnosis: Determining if a patient is Sick or Healthy.
Image Recognition: Identifying images as Cat, Dog, or Bird.
Weather Forecasting: Categorizing weather as Sunny, Rainy, or Cloudy.
Examples of Regression:
Real Estate: Predicting House Prices, such as \(100,000 or \)200,000.
Meteorology: Forecasting Temperature, like 72°F or 75°F.
Sales Projections: Estimating monthly Sales, e.g., $5,000.
Height Estimation: Predicting a child’s Height, such as 5.8 feet.
3. When to Use Each#
Use Classification when:
You’re answering Yes/No questions, such as determining whether a patient has a disease or not.
You’re putting things into categories, like sorting emails into Spam or Not Spam based on their content.
You need to make discrete choices, for instance, deciding which product category a new item belongs to.
Use Regression when:
You’re predicting a specific number, such as estimating the future sales revenue for a business.
You’re forecasting amounts, like predicting the total expenses for the upcoming month based on historical data.
You need continuous outputs, such as calculating the expected temperature for a given day.
4. Input vs Output Types#
Think of it like cooking:
Classification: You look at ingredients (inputs) to decide what dish you’re making (category output)
Regression: You look at recipe quantities (inputs) to predict cooking time (numerical output)
Key Concepts#
1. Continuous vs Discrete Outputs#
Continuous (Regression):
Like a volume knob that smoothly goes from 0 to 100
Can take any value within a range
Example: Temperature can be 72.1°F, 72.2°F, 72.15°F
Discrete (Classification):
Like a light switch that’s either ON or OFF
Takes specific, separate values
Example: A movie rating can be 1, 2, 3, 4, or 5 stars
2. Binary vs Multi-class Classification#
Binary Classification:
Like a coin toss: Heads or Tails
Only two possible outcomes
Examples:
Pass/Fail
Win/Lose
Spam/Not Spam
Multi-class Classification:
Like choosing ice cream flavors
Three or more possible categories
Examples:
Rock/Paper/Scissors
Dog Breeds
Movie Genres
3. Prediction Types#
Think of predictions like different types of questions:
Classification Questions:
“Is this fruit an apple or banana?”
“Will it rain today?”
“Is this transaction fraudulent?”
Regression Questions:
“How much will this house sell for?”
“What will the temperature be tomorrow?”
“How many customers will visit today?”
The key difference is whether you’re putting things in categories (classification) or predicting a specific number (regression). It’s like the difference between sorting your books by genre (classification) versus arranging them by page count (regression)!
Exercise: Understanding Classification and Regression#
Let’s practice identifying different types of machine learning problems. For each scenario, select whether it’s Classification or Regression:
Scenario |
Your Answer |
|---|---|
Predicting tomorrow’s stock price |
|
Determining if an email is spam |
|
Estimating a person’s age from a photo |
|
Categorizing news articles by topic |
|
Forecasting monthly sales revenue |
|
Identifying animal species in photos |
|
Predicting a student’s test score |
|
Detecting fraudulent transactions |
Linear Regression (Regression)#
Basics#
1. Simple Line Fitting#
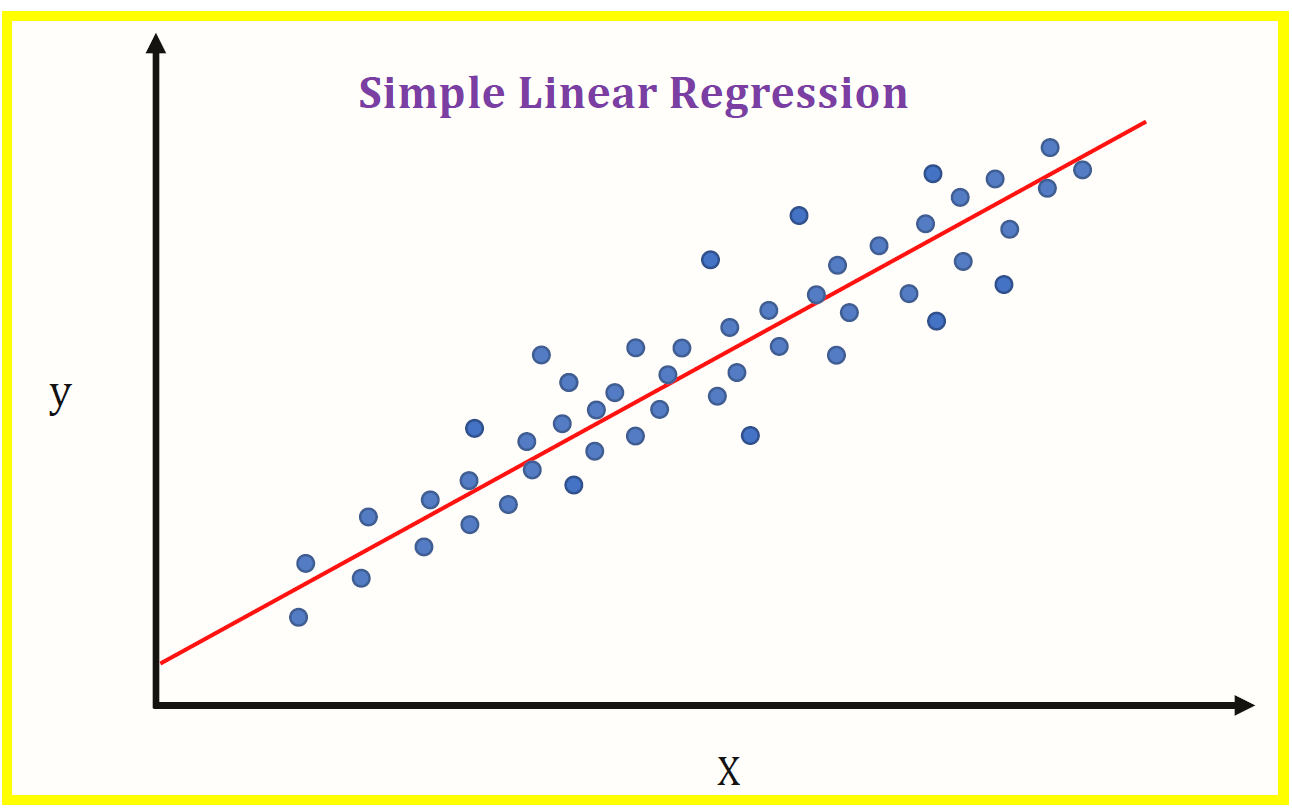
Think of linear regression like playing connect the dots, but with a twist. Instead of connecting every dot, you’re trying to draw ONE straight line that best represents all dots.
Imagine plotting your ice cream sales:
The line you draw shows the relationship: as temperature goes up, so do ice cream sales!
The “best fit” line is like finding the fairest way to show the relationship between study time and scores. It won’t hit every point perfectly, but it shows the general trend.
2. House Price Example#
Let’s use houses because everyone understands them:
Imagine you have these houses:
1000 sq ft → $100,000
2000 sq ft → $200,000
3000 sq ft → $300,000
You can see the pattern: for every 1000 sq ft increase, the price goes up by $100,000. That’s a linear relationship!
3. Equation Form#
The equation is like a simple recipe:
Price = (Price per sq ft × Size) + Base Price

In math terms:
y = mx + b

Where:
y = what we're predicting (price)
m = rate of change (price per sq ft)
x = what we know (house size)
b = starting point (base price)
Remember: Linear regression is like finding the “golden rule” in your data - it might not be perfect for every single case, but it gives you a reliable way to make predictions based on patterns you’ve seen before!
Components#
1. Slope and Intercept#
Think of a slide at a playground:
Slope is how steep the slide is
Intercept is how high off the ground the slide starts
Height │   /
      │  /  ← Slope (steepness)
      │ /
      │/← Intercept (starting height)
      └─────────
        Distance
Real-Life Example:
Ice Cream Sales:
Slope: For every 1°F increase, sales go up by $10
Intercept: Even on the coldest day, you sell $50 worth of ice cream
2. Features and Targets#
Features are the characteristics or attributes of the data that are used to predict the target variable.
Targets, on the other hand, are the outcomes or responses that we are trying to predict.
Real-World Example: House Price Prediction:
Features (What you know):
Square footage
Number of bedrooms
Age of house
Location
Target (What you predict):
House price
3. Assumptions#
Linear regression relies on certain assumptions to ensure the model is reliable and accurate. These assumptions are essential to validate before interpreting the results or making predictions.
1. Linearity
Like a rubber band stretched between points
Relationship should be straight, not curved
Example: More study time = Better grades (usually true)
2. Independence
Like separate ingredients in a recipe
Each feature should stand on its own
Example: House size and location are independent
3. Equal Variance
Like evenly spread sprinkles on a cupcake
Points should scatter evenly around the line
Good:    Bad:
y │ • •  y │ •
  │• • •   │ ••
  │ • •    │•  •••
  └────    └────
4. Limitations#
Understanding the limitations of linear regression is crucial, just like recognizing when a recipe might not turn out as expected.
1. Can’t Handle Curves
Price │    •
      │  •
      │•    •
      │    •  •
      └─────────
        Size
Real life often has curves
Example: Doubling study time doesn’t double your grade
2. Sensitive to Outliers
For instance, a single luxurious mansion can skew the average house price
Price │        •
      │
      │• • • •
      └─────────
        Size
3. Assumes Linear Patterns
Like expecting temperature to always increase ice cream sales
Doesn’t work for:
Seasonal patterns
Complex relationships
Sudden changes
Remember: Linear regression is like using a ruler to draw through points - it works great for straight-line relationships but struggles with anything curved or complex. It’s simple and useful, but you need to know its limitations!
Implementation#
1. Simple Example#
Think of predicting a child’s height based on their parent’s height:
Single Feature Prediction:
Height │    •
Child  │  •  •
      │ •
      │•   •
      └─────────
        Height Parent
This is the simplest form:
One input (parent’s height)
One output (child’s height)
One straight line relationship
Like using a simple recipe:
More sugar = Sweeter cake
Simple, direct relationship
Easy to understand and predict
2. Multiple Features#
Now imagine predicting house prices with multiple factors:
Think of it like cooking with multiple ingredients:
Single ingredient: Just flour → Basic bread
Multiple ingredients: Flour + Yeast + Salt → Better bread
House Price Example:
Size (like flour - the main ingredient)
Location (like salt - adds value)
Age (like freshness - affects value)
Bedrooms (like extra ingredients)
Each feature adds a new dimension to our prediction, like adding depth to a recipe.
3. Model Training#
Think of training a new chef:
Step 1: Show Examples
Like showing a chef many cakes
The chef learns from each example
Builds understanding of what works
Step 2: Practice and Adjust
Chef tries making cakes
Compares results with examples
Makes small adjustments
Step 3: Fine-Tuning
Like perfecting a recipe
Small tweaks to improve results
Learning from mistakes
The model learns like a chef:
Sees many examples
Finds patterns
Adjusts its “recipe” (line)
Gets better with more data
4. Making Predictions#
Like using a recipe after mastering it:
The Process:
Gather Inputs
Like collecting ingredients
Get all needed features
Apply the Formula
Like following the recipe
Use the learned pattern
Get Prediction
Like the finished dish
Your estimated value
Real Example: House Price Prediction:
Known:
- Size: 2000 sq ft
- Age: 5 years
- Location: Good area

↓ Apply learned pattern ↓

Prediction: $300,000
Think of it like a well-trained chef:
Sees ingredients (features)
Knows the recipe (learned pattern)
Predicts outcome (final dish)
Remember: Implementation is like learning to cook:
Start simple (one ingredient)
Add complexity (more ingredients)
Practice (training)
Finally, make predictions (cook independently)
The beauty of linear regression is that once trained, it’s like having a reliable recipe - input the ingredients (features), and you’ll get a predictable output (prediction)!
Logistic Regression (Classification)#
Imagine you’re a doctor trying to decide if someone has a cold or not - you don’t just make a random guess, you look at symptoms and make an informed yes/no decision. That’s what logistic regression does!
Core Concepts#
1. Binary Classification#
Think of binary classification like a light switch:
Only two possible outcomes: ON or OFF
No in-between states
Clear decision required
Real-Life Examples:
Email: Spam or Not Spam
Medical: Sick or Healthy
Banking: Approve or Deny Loan
Weather: Will Rain or Won’t Rain
2. Probability Output#
Instead of just yes/no, logistic regression gives you a confidence level, like a weather forecast:
0% -------- 50% -------- 100%
Definitely   Unsure    Definitely
    No                   Yes
Think of it like:
90% chance of rain → Bring umbrella
30% chance of rain → Maybe don’t worry
50% chance → Tough decision!
3. S-shaped Curve#
Imagine pushing a boulder up a hill:
Success │    ⌒⌒⌒
Chance  │  ⌒
        │⌒
        │
        └─────────
         Effort
The S-curve (sigmoid) shows how probability changes:
Bottom: Very unlikely to succeed
Middle: Rapid change zone
Top: Very likely to succeed
Real-Life Example:
Studying for a test:
0-2 hours: Likely to fail
3-5 hours: Big improvement in chances
6+ hours: Diminishing returns
4. Decision Boundary#
Think of this like a fence dividing two groups:
Health  │  • • ❌ ❌
Score   │ •  |  ❌ ❌
        │• • |   ❌
        │ •  |  ❌
        └────|─────
         Temperature
         (Decision Line)
Real-World Examples:
Credit Score: Above 700 → Approve loan
Test Score: Above 70% → Pass
Temperature: Above 100°F → Fever
Think of it like:
A bouncer deciding who enters a club
A teacher grading pass/fail
A doctor diagnosing sick/healthy
Remember: Logistic regression is like a smart judge:
Looks at evidence (features)
Calculates probability
Makes a yes/no decision
Shows confidence in the decision
It’s perfect for when you need to make binary choices with confidence levels, like deciding whether to take an umbrella based on weather conditions!
Applications#
1. Spam Detection#
Think of a mail sorter at a post office, but for emails:
How It Works:
Looks at key features:
Sender’s address (like checking return address)
Email content (like peeking through envelope window)
Links present (like checking for suspicious packages)
Time sent (like noting when mail arrives)
Decision Process:
Features → Probability → Decision
"FREE MONEY!" → 95% → Spam
"Meeting at 3" → 5% → Not Spam
2. Medical Diagnosis#
Like a very experienced doctor making quick decisions:
Disease Detection:
Looks at symptoms (features):
Temperature
Blood pressure
Age
Medical history
Example: Flu Diagnosis
Symptoms         → Probability → Decision
Fever: 101°F    │
Cough: Yes      │→ 85% → Likely Flu
Fatigue: High   │
Contact: Yes    │
3. Credit Approval#
Like a bank manager deciding to lend money:
Key Factors:
Income (like checking salary)
Credit History (like reading references)
Employment (like job stability)
Existing Debts (like current responsibilities)
Decision Making:
Good Signs        Bad Signs
High Income       Late Payments
Stable Job        High Debt
Long History      No Employment
↓                 ↓
Higher Approval   Lower Approval
Probability       Probability
4. Customer Conversion#
Like a shop owner predicting who will buy:
Customer Journey:
Browse → Interest → Purchase
   ↓        ↓         ↓
 20%      50%       80%
Chance   Chance    Chance
Features Considered:
Time spent looking (like browsing time in store)
Items viewed (like trying clothes)
Previous purchases (like regular customer)
Cart value (like basket size)
Real Example:
Customer Behavior       → Probability → Action
Views: Many            │
Time: 30 mins         │→ 75% → Show Special Offer
Cart: Has Items       │
Previous: Purchased   │
Remember: In all these applications, Logistic Regression acts like an experienced decision-maker:
Gathers relevant information
Weighs different factors
Calculates probability
Makes yes/no decisions
It’s like having:
A smart spam filter for emails
An experienced doctor for diagnosis
A fair bank manager for loans
A skilled salesperson for conversions
The beauty is in its simplicity - just like a good judge, it takes complex information and delivers clear, binary decisions with confidence levels!
Key Elements#
1. Threshold Values#
Think of threshold like the height requirement at an amusement park ride:
Too Short │ │ Tall Enough
│ │
🧍♂️ │ 🧍 │ 🧍♀️
4'8" │ 5'0" │ 5'2"
│ │
NO │ LINE │ YES
Real-World Examples:
Credit Score: Below 700 = Deny, Above 700 = Approve
Test Scores: Below 70% = Fail, Above 70% = Pass
Fever: Below 100.4°F = Normal, Above 100.4°F = Fever
The threshold is your decision line - like drawing a line in the sand.
2. Probability Interpretation#
Think of it like weather forecasts:
0% -------- 50% -------- 100%
Definitely   Maybe    Definitely
Will Rain    Rain     Will Rain
Example: Loan Approval
90% probability → Almost certainly approve
60% probability → Leaning towards approval
30% probability → Probably deny
10% probability → Almost certainly deny
Like a doctor’s confidence in a diagnosis:
“I’m 95% sure it’s just a cold”
“There’s a 20% chance of complications”
3. Binary Output#
Like a simple yes/no question:
Are you over 18? Yes/No
Is it raining? Yes/No
Did the team win? Yes/No
Think of it as a light switch:
Input → Decision → Output
         │
    ┌────┴────┐
    │         │
   OFF       ON
    0         1
No middle ground - just like:
Pregnant or not pregnant
Spam or not spam
Passed or failed
4. Feature Impact#
Like ingredients affecting a recipe’s success:
Strong Impact Features:
Like salt in cooking (a little makes big difference)
Like studying for test scores
Like location for house prices
Weak Impact Features:
Like garnish on a dish (nice but not crucial)
Like shoe color for running speed
Like paint color for house price
Example: Email Spam Detection
Feature         Impact
-----------------
ALL CAPS       Strong ⬆️
Known Sender   Strong ⬇️
Time Sent      Weak   ↕️
Email Length   Weak   ↕️
Think of it like packing for a trip:
Important items (passport, tickets) → Strong impact
Nice-to-have items (extra socks) → Weak impact
Remember: Logistic Regression elements work together like a good judge:
Uses a clear threshold (like law guidelines)
Provides confidence levels (like judge’s certainty)
Makes binary decisions (like guilty/not guilty)
Weighs evidence appropriately (like case facts)
It’s all about making clear yes/no decisions while understanding how confident we are in those decisions!
Decision Trees#
Imagine playing a game of “20 Questions” or following a flowchart to decide what to wear - that’s exactly how decision trees work!
Tree Structure#
1. Root Node#
Think of the root node like the first question in “20 Questions”:
"Is it alive?"
     ↙    ↘
   Yes     No
It’s like the main entrance to a maze:
Everyone starts here
First major decision point
Most important question
Real-Life Example:
"Is it raining?"
     ↙    ↘
  Yes      No
(Take     (Leave
umbrella)  umbrella)
2. Decision Nodes#
Like a series of follow-up questions, each leading to more specific answers:
Is it hot outside?
    ↙         ↘
   Yes         No
   ↙           ↘
Shorts      Is it raining?
           ↙          ↘
         Yes           No
         ↓             ↓
      Raincoat      Sweater
Think of it like:
A doctor’s diagnosis questions
A customer service flowchart
A choose-your-own-adventure book
3. Leaf Nodes#
These are your final answers - like reaching the end of your journey:
Should I order pizza?
       ↙         ↘
 Hungry?         Not Hungry
   ↙    ↘         ↓
 Money?   No    Don't Order
 ↙    ↘   ↓
Yes    No  Don't
 ↓     ↓   Order
Order Don't
      Order
Leaf nodes are like:
Final diagnosis in medicine
End of a quiz
Final decision in a flowchart
4. Splitting Rules#
Think of splitting rules like sorting laundry:
Simple Split:
Clothes
   ↙    ↘
Light   Dark
Complex Split:
Clothes
  ↙   |   ↘
White Color  Dark
     ↙  ↘
  Light  Bright
Real-World Example - Restaurant Choice:
Budget?
  ↙     ↘
<$20    >$20
  ↙       ↘
Fast    Cuisine Type?
Food    ↙    |    ↘
     Italian Asian Steak
Splitting Rules are like:
Questions in a quiz
Filters when shopping
Sorting criteria
Remember: A decision tree is like:
A smart flowchart
A game of “20 Questions”
A choose-your-own-adventure book
A series of sorting decisions
Each decision leads you closer to the final answer, just like following directions to a destination!
Learning Process#
1. Feature Selection#
Think of feature selection like choosing questions for a guessing game:
Good Questions:
Like “Is it bigger than a car?” (Divides options clearly)
Like “Does it live in water?” (Separates clearly)
Like “Is it more expensive than $100?” (Clear distinction)
Bad Questions:
Like “Is it nice?” (Too subjective)
Like “What color is it?” (Too many options)
Like “How heavy is it?” (Too complex)
Think of it like a detective choosing the most important clues:
Crime Scene Clues:
✓ Forced entry (Very informative)
✓ Time of crime (Important)
✗ Weather that day (Less relevant)
✗ Street name (Not helpful)
2. Split Criteria#
Imagine sorting books in a library:
Good Splits:
Books
  ↙     ↘
Fiction  Non-Fiction
  ↙         ↘
Kids      Reference
Adult     Textbooks
Think of it like:
Sorting laundry (Clear categories)
Organizing groceries (Logical groups)
Classifying emails (Clear distinctions)
The best splits are like good party seating arrangements:
Clear grouping logic
Similar things together
Different things apart
3. Tree Growth#
Like growing a real tree, but upside down:
Should I go out?
     ↙        ↘
Raining?     Sunny?
 ↙   ↘       ↙    ↘
Yes   No    Hot   Cool
 ↓    ↓     ↓     ↓
Stay  Go   Beach  Park
Think of it like:
Starting with trunk (main question)
Adding branches (more specific questions)
Reaching leaves (final decisions)
Like a plant growing:
Starts small (root node)
Grows branches (decisions)
Stops at natural endpoints
4. Pruning Basics#
Like trimming a bonsai tree to keep it healthy:
Before Pruning:
Ice Cream Choice
    ↙     ↘
Flavor?   Size?
 ↙  ↘     ↙   ↘
Van Choc  S    M
 ↙   ↘
Hot Cold  (Too detailed!)
After Pruning:
Ice Cream Choice
    ↙     ↘
Flavor?   Size?
 ↙  ↘     ↙   ↘
Van Choc  S    M
Think of pruning like:
Editing a long story (removing unnecessary details)
Simplifying directions (keeping important turns)
Cleaning up a messy room (removing clutter)
Remember: The learning process is like:
A child learning to ask better questions
A gardener growing and shaping a tree
A detective focusing on important clues
The goal is to:
Ask smart questions (Feature Selection)
Make clear divisions (Split Criteria)
Build systematically (Tree Growth)
Keep it simple (Pruning)
Just like in real life, sometimes simpler decisions are better than complex ones!
Advantages/Limitations#
1. Easy to Understand#
Think of decision trees like giving directions to your house:
Why They’re Easy:
Get to My House:
     ↙         ↘
See McDonald's?  Keep Going
     ↙
Turn Right
     ↙
Red House
Like following a recipe:
Clear steps
Yes/No decisions
Visual flow
No complex math
Real-Life Comparison:
GPS: “Turn left in 0.7 miles” (Complex)
Friend: “Turn left at the big red barn” (Like a decision tree)
2. Overfitting Risk#
Think of overfitting like memorizing a textbook instead of understanding the concepts:
Too Simple (Underfitting):
Is it raining?
   ↙      ↘
  Yes      No
  ↓        ↓
Umbrella   No Umbrella
Too Complex (Overfitting):
Is it raining?
   ↙      ↘
Heavy?    Cloudy?
 ↙  ↘     ↙    ↘
Yes  No  Dark? Bright?
 ↓   ↓    ↓     ↓
Big Small Maybe  None
Like a student who:
Memorizes exact test questions
Struggles with slightly different problems
Can’t apply knowledge to new situations
3. When to Use#
Perfect for situations like:
Good Scenarios:
Customer Service Flowcharts
Problem Type?
   ↙        ↘
Technical   Billing
   ↙          ↘
Reset      Check Account
Device     Balance
Medical Diagnosis
Restaurant Decision-Making
Product Recommendations
Not Great For:
Predicting exact house prices
Continuous predictions
Complex relationships
Like choosing between:
A recipe book (Decision Tree) → Good for clear steps
A seasoned chef’s intuition (Other Models) → Better for subtle adjustments
4. Real Examples#
Netflix Show Recommendations:
Like Action?
    ↙      ↘
  Yes       No
   ↙         ↘
Watch         Like Romance?
Marvel?        ↙        ↘
   ↙          Yes       No
Superhero    Rom-Com   Documentary
Bank Loan Approval:
Income > 50k?
    ↙      ↘
   Yes      No
    ↙        ↘
Credit       Savings > 10k?
Score?        ↙        ↘
 ↙    ↘      Yes       No
Good  Bad    Maybe     Deny
 ↓     ↓
Approve Deny
Email Sorting:
From Known Sender?
     ↙        ↘
    Yes        No
     ↙          ↘
Important     Contains
Contact?     "Urgent"?
 ↙    ↘       ↙    ↘
Yes    No    Yes    No
 ↓     ↓     ↓     ↓
Priority Regular Check  Spam
Remember: Decision Trees are like:
A good friend giving directions (Easy to follow)
A strict rulebook (Can be too rigid)
A choose-your-own-adventure book (Clear paths)
They’re perfect when you need:
Clear decisions
Explainable results
Simple rules
But be careful of:
Making too many specific rules
Complex numerical predictions
Situations needing flexibility
Just like in real life, sometimes simple, clear decisions work best, but other times you need more nuanced approaches!
Random Forests#
Imagine instead of asking one friend for advice, you ask many friends and take a vote - that’s basically what Random Forests do!
Ensemble Basics#
1. Multiple Trees#
Think of it like getting multiple opinions:
Should I buy this house?

Friend 1's Decision Tree:
Price?
  ↙    ↘
High   Low
 ↓      ↓
No    Yes

Friend 2's Decision Tree:
Location?
  ↙    ↘
Good   Bad
 ↓      ↓
Yes    No

Friend 3's Decision Tree:
Size?
  ↙    ↘
Big   Small
 ↓      ↓
Yes    No
Like having:
Multiple doctors for a diagnosis
Different teachers grading a paper
Several experts giving advice
2. Voting System#
Think of it like a group decision at a restaurant:
Where to eat?
Tree 1: "Italian"
Tree 2: "Italian"
Tree 3: "Chinese"
Tree 4: "Italian"
Tree 5: "Mexican"

Final Decision: Italian (3 votes wins!)
Like:
Class voting for field trip destination
Jury reaching a verdict
Family deciding on vacation spot
3. Bagging Process#
Imagine different chefs making the same dish with slightly different ingredients:
Chef 1:
Uses tomatoes, pasta, herbs
Makes Italian dish
Chef 2:
Uses pasta, garlic, cheese
Makes Italian dish
Chef 3:
Uses herbs, cheese, tomatoes
Makes Italian dish
Each chef:
Gets random ingredients (random data samples)
Makes their best dish (builds their tree)
Contributes to final menu (votes for prediction)
4. Random Selection#
Like different people packing for the same trip:
Packing List Options:
- Clothes
- Toiletries
- Electronics
- Books
- Snacks
- Maps

Person 1 considers: Clothes, Electronics, Maps
Person 2 considers: Toiletries, Books, Clothes
Person 3 considers: Snacks, Electronics, Toiletries
Think of it like:
Different judges looking at different aspects of a competition
Multiple detectives focusing on different clues
Various doctors specializing in different symptoms
Remember: Random Forests work like:
A panel of experts (multiple trees)
Each expert looks at different evidence (random selection)
They vote on the final decision (voting system)
Each uses slightly different information (bagging)
It’s like getting advice from a group of wise friends:
Each friend has different experiences
They look at different aspects
They vote on what’s best
Together, they make better decisions than any one alone
The power comes from diversity and democracy - just like in real life, multiple viewpoints often lead to better decisions!
Key Features#
1. Feature Importance#
Think of this like ranking ingredients in a popular restaurant:
Recipe Success Factors:
🥇 Fresh Ingredients (Used in 90% of good reviews)
🥈 Cooking Temperature (Used in 70% of good reviews)
🥉 Plating Style (Used in 30% of good reviews)
⭐ Garnish Type (Used in 5% of good reviews)
Like a chef learning that:
Fresh ingredients matter most
Temperature is crucial
Plating is less important
Garnish barely affects taste
Real-World Example:
House Price Factors:
Location: 45% importance
Size: 30% importance
Age: 15% importance
Paint Color: 2% importance
2. Out-of-bag Error#
Think of this like having a practice audience before a big performance:
Main Show: 100 audience members
Practice Groups:
- Group 1: 30 different people
- Group 2: 30 different people
- Group 3: 30 different people
Like:
Testing a joke on friends before a speech
Trying recipes on family before a party
Practicing presentation on colleagues
Each tree gets tested on data it hasn’t seen, like:
A chef testing recipes on new customers
A teacher testing methods on different classes
A comedian trying jokes on new audiences
3. Parallel Trees#
Imagine multiple chefs working in different kitchen stations:
Restaurant Kitchen:
👩🍳 Chef 1: Making appetizers
👨🍳 Chef 2: Making main course
👩🍳 Chef 3: Making dessert
👨🍳 Chef 4: Making drinks
All working at the same time!
Like:
Multiple cashiers serving customers
Different assembly lines in a factory
Several security guards watching different areas
Benefits:
Faster results (like multiple workers)
Independent work (no waiting for others)
Efficient use of resources
4. Majority Voting#
Think of it like a group of friends deciding on a movie:
Movie Choice Votes:
Action: |||  (3 votes)
Comedy: ||   (2 votes)
Drama:  |||| (4 votes)
Horror: |    (1 vote)

Winner: Drama (most votes)
Real-World Example:
Weather Prediction:
Tree 1: "Rain"
Tree 2: "Rain"
Tree 3: "Sun"
Tree 4: "Rain"
Tree 5: "Sun"

Final Forecast: Rain (3 vs 2 votes)
Like:
Jury reaching verdict
Committee making decisions
Class choosing field trip destination
Remember: Random Forests key features work like:
A cooking competition (Feature Importance)
Judges note what makes dishes win
Preview audience (Out-of-bag Error)
Testing on fresh audiences
Restaurant kitchen (Parallel Trees)
Multiple chefs working simultaneously
Democratic vote (Majority Voting)
Final decision based on most votes
It’s like having a well-organized team:
Everyone knows what’s important
They test their work
They work efficiently
They make decisions together
The power comes from combining multiple perspectives while understanding what really matters!
Practical Use#
1. Parameter Tuning#
Think of this like adjusting your car settings for the perfect drive:
Car Settings:
Speed Limit ←→ Accuracy
Comfort    ←→ Performance
Fuel Mode  ←→ Efficiency
Like cooking adjustments:
Heat Level (How detailed each tree is)
Too high: Burns the food (overfitting)
Too low: Raw food (underfitting)
Just right: Perfect cooking
Key Parameters:
Tree Depth:
Shallow ←→ Deep
(Simple)   (Complex)

Split Size:
Small  ←→ Large
(Detailed) (General)
2. Forest Size#
Like deciding how many judges for a competition:
Too Few Judges:
👨⚖️👩⚖️ (2 judges)
- Tied votes possible
- Limited perspectives
- Quick but unreliable
Good Balance:
👨⚖️👩⚖️👨⚖️👩⚖️👨⚖️ (5 judges)
- Clear majority possible
- Multiple viewpoints
- Efficient decision-making
Too Many Judges:
👨⚖️👩⚖️👨⚖️👩⚖️👨⚖️👩⚖️👨⚖️👩⚖️👨⚖️👩⚖️ (10 judges)
- Slow decisions
- Diminishing returns
- Resource intensive
3. Feature Selection#
Like packing for a trip - choosing what’s important:
Essential Features:
Vacation Packing:
✓ Passport (Must-have)
✓ Money   (Critical)
✓ Phone   (Important)
✗ Extra shoes (Optional)
✗ Fifth book (Unnecessary)
Think of it like:
Choosing ingredients for a recipe
Selecting players for a team
Picking tools for a job
4. Real Applications#
Financial Predictions:
Bank Loan Approval:
- Income History
- Credit Score
- Employment Status
→ Approve/Deny Decision
Medical Diagnosis:
Disease Detection:
- Symptoms
- Test Results
- Patient History
→ Diagnosis
Customer Behavior:
Shopping Predictions:
- Past Purchases
- Browsing History
- Cart Items
→ Will They Buy?
Weather Forecasting:
Weather Prediction:
- Temperature
- Humidity
- Wind Speed
- Pressure
→ Rain or No Rain
Remember: Using Random Forests is like:
Running a restaurant kitchen
Right number of chefs (Forest Size)
Proper cooking settings (Parameter Tuning)
Essential ingredients only (Feature Selection)
Various menu items (Applications)
Best Practices:
Start simple, then add complexity
Monitor performance
Use enough trees, but not too many
Focus on important features
Think of it like building a team:
Right number of people
Right skills and tools
Right focus areas
Right applications
The goal is to find the sweet spot between:
Accuracy (good predictions)
Efficiency (reasonable speed)
Simplicity (manageable complexity)
Just like in real life, balance is key to success!
XGBoost#
Think of XGBoost like training a team of specialists who learn from each other’s mistakes!
Boosting Concepts#
1. Sequential Learning#
Imagine learning to cook a complex dish:
Day 1: Learn basic cooking
↓
Day 2: Learn from Day 1 mistakes
↓
Day 3: Perfect what was missed
↓
Day 4: Master the final details
Like a relay race where:
First runner sets the pace
Second runner learns from first’s strategy
Third runner adjusts based on previous legs
Each runner improves the overall performance
2. Weak Learners#
Think of weak learners like a team of okay-but-not-great specialists:
House Price Prediction Team:
👤 Bob: Good at judging by size only
👤 Alice: Expert in location only
👤 Charlie: Focuses on age only
👤 Diana: Looks at condition only

Together → Strong Prediction!
Like a detective agency where:
No one detective knows everything
Each has a specific strength
Combined knowledge solves cases
Together they’re brilliant
3. Gradient Boosting#
Imagine painting a picture by fixing mistakes:
Portrait Painting:
First Try: Basic outline
   ↓
Second: Fix the eyes
   ↓
Third: Improve the smile
   ↓
Final: Perfect the details
Like learning from mistakes:
Start with rough work
Focus on biggest errors
Gradually refine
Each step improves accuracy
4. Error Correction#
Think of it like tuning a musical performance:
Band Practice:
🎸 Guitarist: Too loud
  ↓
🥁 Drummer: Adjusts volume
  ↓
🎤 Singer: Balances with new level
  ↓
🎹 Pianist: Fine-tunes the harmony
Real-World Example:
Sales Prediction:
Model 1: Predicts $1000 (actual: $1200)
Model 2: Focuses on $200 gap
Model 3: Refines remaining error
Final: Nearly perfect prediction
Remember: XGBoost works like:
A learning journey (Sequential)
Each step builds on previous knowledge
A team of specialists (Weak Learners)
Each member has specific skills
An artist fixing mistakes (Gradient Boosting)
Gradually improving the picture
A band tuning their sound (Error Correction)
Each adjustment makes it better
It’s like having a team that:
Learns from mistakes
Builds on strengths
Fixes weaknesses
Constantly improves
The magic is in the progression - each step makes the previous one better!
Key Components#
1. Learning Rate#
Think of learning rate like adjusting the speed of learning a new language:
Learning Speed Options:
🐢 Slow and Steady (0.01)
- Like learning 2 words per day
- Very thorough but takes time
- Less likely to make mistakes

🚶 Medium Pace (0.1)
- Like learning 10 words per day
- Good balance of speed and retention
- Moderate risk of mistakes

🏃 Fast Track (0.3)
- Like learning 30 words per day
- Quick progress but might forget
- Higher risk of mistakes
Like cooking adjustments:
Small adjustments = More precise but slower
Large adjustments = Faster but might overcook
2. Tree Depth#
Imagine organizing a company hierarchy:
Shallow Tree (Depth = 2):
        CEO
    /         \
Manager1    Manager2
(Simple but might miss details)

Deep Tree (Depth = 4):
           CEO
      /           \
  Director1    Director2
   /     \      /     \
Mgr1    Mgr2  Mgr3   Mgr4
  |       |     |      |
Staff   Staff  Staff  Staff
(Detailed but might be too complex)
Like organizing a library:
Shallow: Just Fiction/Non-Fiction
Medium: Categories (Mystery, Science, etc.)
Deep: Very specific sub-categories
3. Number of Trees#
Think of it like getting multiple opinions:
Few Trees (10):
👤👤👤👤👤
👤👤👤👤👤
- Quick decisions
- Might miss patterns
- Like asking 10 friends

Many Trees (100):
👤👤👤👤👤 × 20
- More reliable
- Takes longer
- Like surveying 100 people

Too Many Trees (1000+):
👤👤👤👤👤 × 200
- Diminishing returns
- Resource intensive
- Like asking entire town
4. Regularization#
Think of regularization like training wheels on a bike:
No Regularization:
🚲 → 💨 → 💫 → 💥
(Might overfit and crash)

With Regularization:
🚲 → 🛡️ → 🛡️ → ✅
(Controlled, stable ride)
Like setting boundaries:
Speed limits on a road
Recipe measurements
Budget constraints
Real-World Example:
Training a Chef:
Learning Rate: How much to adjust recipe each time
Tree Depth: How complex the recipes can be
Number of Trees: How many recipes to master
Regularization: Following standard cooking rules
Remember: These components work together like:
Learning Rate = Speed of learning
Tree Depth = Level of detail
Number of Trees = Amount of opinions
Regularization = Safety controls
Finding the right balance is like:
Cooking the perfect meal
Right temperature (Learning Rate)
Right complexity (Tree Depth)
Right number of tries (Number of Trees)
Right rules (Regularization)
The goal is to find the sweet spot where:
Learning is efficient
Details are appropriate
Opinions are sufficient
Rules prevent mistakes
Just like in cooking, the right combination of ingredients and techniques makes the perfect dish!
Implementation#
1. Basic Setup#
Think of setting up XGBoost like preparing a kitchen for cooking:
Essential Components:
Kitchen Setup:
1. Basic Tools (Data Preparation)
   - Cutting board (Clean data)
   - Knives (Feature processing)
   - Bowls (Data organization)

2. Recipe Book (Model Structure)
   - Ingredients list (Features)
   - Steps to follow (Parameters)
   - Expected outcome (Target)
Like preparing for a big meal:
Clean workspace (Clean data)
Right tools ready (Libraries)
Recipe planned (Model structure)
2. Parameter Selection#
Like adjusting settings on a new appliance:
Basic Settings (Start Here):
learning_rate: 0.1    (Like stove temperature)
max_depth: 3-6        (Like recipe complexity)
n_estimators: 100     (Like cooking time)

Advanced Settings (Fine-Tune Later):
subsample: 0.8        (Like ingredient portions)
colsample_bytree: 0.8 (Like spice selection)
min_child_weight: 1   (Like minimum serving size)
Think of it like:
Starting with basic recipe
Adjusting to taste
Fine-tuning for perfection
3. Common Pitfalls#
Like common cooking mistakes to avoid:
🚫 Overfitting:
- Like overcooking food
- Too many trees
- Too deep trees
- Learning rate too high

🚫 Underfitting:
- Like undercooked food
- Too few trees
- Too shallow trees
- Learning rate too low

🚫 Data Issues:
- Like bad ingredients
- Missing values
- Noisy data
- Imbalanced classes
4. Performance Tips#
Think of these like kitchen efficiency tips:
Speed Improvements:
1. Data Preparation
   - Pre-cut ingredients (Feature engineering)
   - Organize workspace (Memory management)
   - Prep in advance (Data preprocessing)

2. Model Efficiency
   - Use right pot size (GPU vs CPU)
   - Batch cooking (Batch processing)
   - Parallel preparation (Multi-threading)
Accuracy Improvements:
Early Stage:
- Start simple (Basic recipe)
- Monitor progress (Taste testing)
- Adjust gradually (Fine-tuning)

Later Stage:
- Cross-validation (Different tasters)
- Feature selection (Best ingredients)
- Parameter tuning (Perfect seasoning)
Remember: Implementing XGBoost is like running a professional kitchen:
Good Practices:
Start with basics
Monitor progress
Adjust carefully
Learn from mistakes
Workflow:
1. Preparation Phase
   Data → Clean → Organize

2. Basic Model
   Simple → Test → Adjust

3. Fine-Tuning
   Monitor → Improve → Perfect
Think of it like cooking a complex dish:
Start with basic recipe
Add complexity gradually
Test and adjust
Perfect over time
Success comes from:
Good preparation
Careful monitoring
Smart adjustments
Continuous improvement
Just like becoming a master chef, becoming good at XGBoost takes practice and patience!
Model Evaluation Metrics#
Classification Metrics#
1. Accuracy#
Think of accuracy like a student’s overall test score:
In a 100-question test:
90 correct answers = 90% accuracy

Real-World Example:
Email Spam Filter:
- Checked 100 emails
- Correctly identified 95
- Accuracy = 95%
But accuracy alone can be misleading! Like getting an A+ in an easy test.
2. Precision#
Think of precision like a weather forecaster predicting rain:
Forecaster says "Rain":
- Said rain 10 times
- Actually rained 8 times
- Precision = 8/10 = 80%

Like a chef who makes predictions:
"These cookies will be delicious"
- Said it 10 times
- True 8 times
- Wrong 2 times
Precision asks: “When we make a prediction, how often are we right?”
3. Recall#
Think of recall like a parent finding all their kid’s toys:
Toy Collection:
Total toys: 20
Found toys: 16
Missed toys: 4
Recall = 16/20 = 80%

Medical Example:
100 sick patients
- Found 90 sick patients
- Missed 10 sick patients
- Recall = 90%
Recall asks: “Out of all actual cases, how many did we find?”
4. F1-Score#
Think of F1-Score like a balanced restaurant review:
Food Quality (Precision)
Service Speed (Recall)
Overall Experience (F1-Score)
Restaurant Ratings:
Food: 9/10 (Precision)
Service: 7/10 (Recall)
F1-Score: 8/10 (Balanced score)
F1-Score balances precision and recall, like considering both taste AND service.
5. Confusion Matrix#
Think of it like sorting laundry into four baskets:
Predicted vs Actual:

         │ Actually │ Actually
         │  Clean  │  Dirty
─────────┼─────────┼─────────
Said     │   ✓✓    │   ✗✗
Clean    │   TP    │   FN
─────────┼─────────┼─────────
Said     │   ✗✗    │   ✓✓
Dirty    │   FP    │   TN
Real-World Example:
Spam Detection:
        │ Real    │ Real
        │ Spam    │ Not Spam
────────┼─────────┼──────────
Said    │   50    │    5
Spam    │ (True+) │ (False+)
────────┼─────────┼──────────
Said    │   10    │   935
Not Spam│ (False-)│ (True-)
Think of it like:
True Positive (TP): Found treasure where you dug
False Positive (FP): Dug but found nothing
False Negative (FN): Missed treasure by not digging
True Negative (TN): Correctly didn’t dig where no treasure
Remember: These metrics work together like:
Accuracy: Overall score
Precision: When we predict yes, how often are we right?
Recall: How many actual yes cases do we find?
F1-Score: Balance between precision and recall
Confusion Matrix: Detailed breakdown of all predictions
Like a doctor’s diagnosis:
Accuracy: Overall correct diagnoses
Precision: When saying “sick,” how often right?
Recall: Finding all actually sick people
F1-Score: Balance of finding sick people and being right
Confusion Matrix: Complete breakdown of all diagnoses
The key is choosing the right metric for your problem, just like choosing the right tool for a job!
Regression Metrics#
1. Mean Squared Error (MSE)#
Think of MSE like measuring how far your darts are from the bullseye:
Price Predictions:
Actual: $100
Guessed: $120
Error: $20 off
Squared: $400 (20²)

Multiple Guesses:
Guess 1: $20 off → 400
Guess 2: $10 off → 100
Guess 3: $15 off → 225
MSE = (400 + 100 + 225) ÷ 3 = 241.67
Like a golf score:
Bigger errors (far from hole) are punished more
Small errors (close to hole) matter less
Lower score is better
2. R-squared (R²)#
Think of R² like a movie rating percentage:
100% = Perfect prediction
0% = Terrible prediction
75% = Pretty good prediction
Weather Temperature Predictions:
Perfect Model: "It'll be exactly 75°F" → 100%
Bad Model: "Random guess between 0-100°F" → 0%
Good Model: "Between 73-77°F" → 85%
Like a teacher explaining student grades:
How much of the grade is explained by study time?
How much is just random chance?
Higher percentage means better explanation
3. Mean Absolute Error (MAE)#
Think of MAE like measuring recipe ingredient errors:
Cookie Recipe:
Should Use │ Actually Used │ Error
2 cups     │ 2.5 cups     │ 0.5
1 cup      │ 0.8 cups     │ 0.2
3 cups     │ 2.8 cups     │ 0.2
MAE = (0.5 + 0.2 + 0.2) ÷ 3 = 0.3 cups average error
Like measuring distance from target:
Simple to understand
All errors count equally
Shows average mistake size
4. Root Mean Squared Error (RMSE)#
Think of RMSE like measuring your monthly budget errors:
Monthly Budget:
Predicted │ Actual │ Error │ Squared
$1000     │ $1200 │ $200  │ 40,000
$500      │ $600  │ $100  │ 10,000
$300      │ $400  │ $100  │ 10,000

MSE = 20,000 (average of squared errors)
RMSE = √20,000 = $141.42 (average error in dollars)
Like a weather forecast error:
Shows error in original units (dollars, degrees, etc.)
Punishes big mistakes more
Easier to understand than MSE
Remember: These metrics are like different ways to grade performance:
Comparison Table:
Metric │ Like Measuring        │ Best For
MSE    │ Golf score           │ Punishing big errors
R²     │ Movie rating %       │ Overall performance
MAE    │ Recipe mistakes      │ Simple error size
RMSE   │ Budget planning      │ Practical error size
Think of it like:
MSE: How bad are your worst mistakes?
R²: How good is your overall performance?
MAE: What’s your average mistake?
RMSE: What’s your typical error in real terms?
Choose your metric like choosing a measuring tool:
Want to punish big errors? Use MSE
Want simple averages? Use MAE
Want practical measures? Use RMSE
Want overall performance? Use R²
Just like different tools for different jobs, each metric has its perfect use case!
Validation Techniques#
1. Train-Test Split#
Think of this like learning to cook:
Cookbook with 100 recipes:
- 80 recipes to practice with (Training Set)
- 20 recipes to test your skills (Test Set)
Like a driving instructor:
Practice in empty parking lot (Training)
Final test on real roads (Testing)
Why Split?
Good Split:
Practice → Different → Test
(Learn)     (Roads)    (Prove)

Bad Split (Memorization):
Practice → Same → Test
(Memorize)  (Road)  (Repeat)
2. Cross-validation#
Think of this like tasting a soup multiple ways:
5-Fold Cross-validation:
Bowl 1: Taste hot  → Score
Bowl 2: Taste cold → Score
Bowl 3: With bread → Score
Bowl 4: With spice → Score
Bowl 5: Plain      → Score
Final: Average all scores
Like a chef testing a recipe:
Different tasters
Different conditions
Different times
Average all feedback
Data Split Example:
Round 1: [Test][Train][Train][Train][Train]
Round 2: [Train][Test][Train][Train][Train]
Round 3: [Train][Train][Test][Train][Train]
Round 4: [Train][Train][Train][Test][Train]
Round 5: [Train][Train][Train][Train][Test]
3. Holdout Sets#
Think of this like saving the best judge for last:
Cooking Competition:
60% → Practice judges (Training)
20% → Feedback judges (Validation)
20% → Final judge (Test/Holdout)
Like game development:
Development team (Training)
Beta testers (Validation)
Real players (Holdout/Test)
Why Three Sets?
Training: Learn and adjust
    ↓
Validation: Check progress
    ↓
Holdout: Final verification
4. Validation Curves#
Think of this like tracking a student’s learning:
Study Hours vs Test Scores:
Hours │    • •
      │   •
Score │  •
      │ •
      └─────────
        Time
Like learning an instrument:
Initial fast improvement
Slower middle progress
Plateau at expertise
Common Patterns:
Good Learning:
Skill │    ****
      │   *
      │  *
      │ *
      └─────────

Overfitting:
Skill │    *
      │   * *
      │  *   *
      │ *     *
      └─────────
Remember: Validation techniques are like:
Train-Test Split: Practice vs Final Exam
Cross-validation: Multiple Practice Tests
Holdout Sets: Saving Final Judge
Validation Curves: Progress Tracking
Think of it as:
Training: Learning phase
Validation: Practice tests
Testing: Final exam
Curves: Report card
The goal is to:
Learn properly (Training)
Check progress (Validation)
Prove skills (Testing)
Track improvement (Curves)
Just like learning any skill, proper validation ensures real understanding, not just memorization!